|
Parameter |
Active isolation system (TA) |
||
|
Isolation principle |
Passive absorption by rubber/cone |
Air-spring laminar damping |
Active feedback with sensors + actuators |
|
Natural frequency (vertical) |
4–8 Hz |
1.0–2.0 Hz |
< 1 Hz |
|
Isolation efficiency @10Hz |
85%–90% |
95% |
95%–99% |
|
Low-frequency (<5Hz) performance |
Almost ineffective |
Some effect |
Highly effective |
|
Tabletop flatness |
0.05–0.1 mm/m² |
0.05–0.1 mm/m² |
0.05–0.1 mm/m² (tabletop) |
|
Hole spacing |
25 mm (M6) |
25 mm (M6) |
25 mm (M6) |
|
Load capacity |
200–2000 kg |
300–3000 kg |
100–1500 kg |
|
Supporting requirements |
None |
Quiet air compressor |
Controller + power |
|
Installation difficulty |
Low |
Medium |
High (factory commissioning) |
|
Price range |
RMB 10,000–30,000 |
RMB 30,000–40,000 |
RMB 70,000+ |
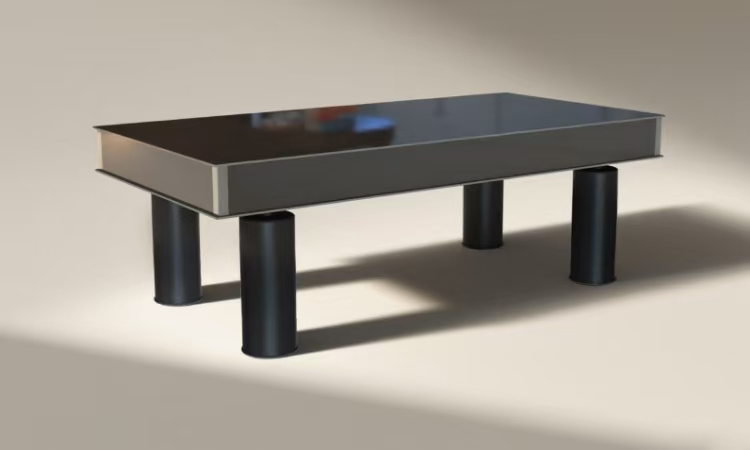
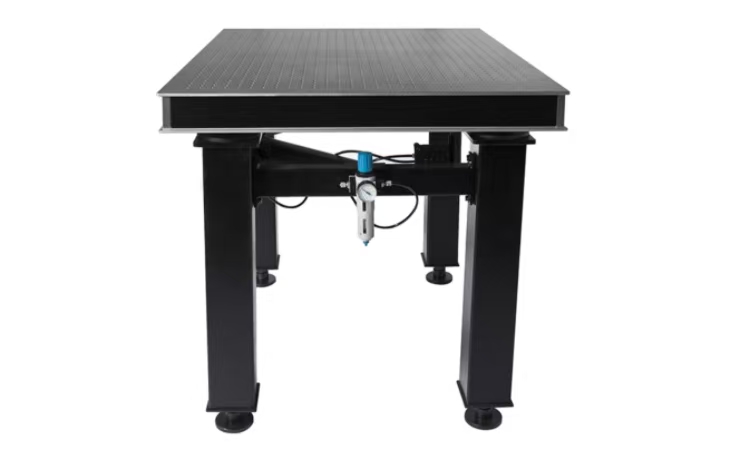
Parameters are based on LeadTop LDT public technical documentation; the ZDT-B pendulum-rod pneumatic table achieves isolation efficiency up to 99%.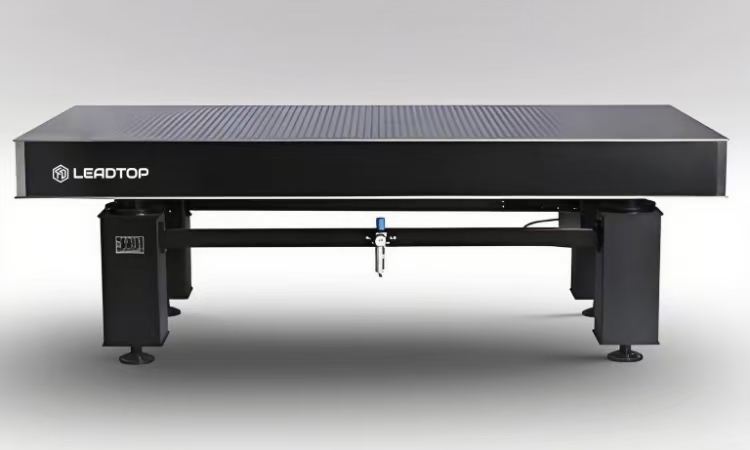
|
Lab scenario |
Equipment vibration tolerance |
LeadTop LDT recommendation |
Key configuration points |
|
Undergraduate teaching |
No explicit requirement |
POT passive isolation table |
Standard size, maintenance-free |
|
Metallurgical / ordinary confocal |
< 100 μm/s |
POT-G / entry-level ZDT-P |
Watch compressor noise |
|
Research-grade confocal |
< 20 μm/s |
ZDT-P pneumatic isolation table |
Flatness ≤ 0.05, good static performance |
|
Fluorescence spectroscopy |
< 20 μm/s |
ZDT-P pneumatic isolation table |
Thickened tabletop reduces vibration |
|
Laser interferometer |
< 5 μm/s |
ZDT-B high-end pneumatic / TA active |
Needs low-frequency isolation capability |
|
SEM / TEM |
< 2 μm/s |
TA series / LVH-T15 active |
Six DOF, assessment mandatory |
|
Semiconductor inspection |
Heavy load |
Heavy-duty pneumatic / TA |
Load capacity + rigidity first |
|
Metrology & quality inspection |
< 5 μm/s |
ZDT-B high-end pneumatic |
Flatness ≤ 0.02 |
|
Error |
Consequence |
Correct approach |
|
Small equipment on a large tabletop |
Unloaded natural frequency rises |
Calculate the full-load frequency from the equipment weight |
|
Only looking at the natural frequency |
Resonance peak amplifies a frequency band |
Ask for the complete isolation efficiency curve |
|
Passive table in a high-rise |
Low-frequency vibration not isolated |
At least pneumatic + on-site assessment |
|
Ignoring compressor noise |
Disturbs the lab environment |
Choose a quiet type < 55 dB or place it outside |
|
Active table sensors placed arbitrarily |
Can amplify vibration |
Require the manufacturer's layout plan + report |
Q: Which parameters matter most for an isolation table?
A: Four cores — ① natural frequency (the lower, the better it isolates low frequencies; LeadTop LDT ZDT-P pneumatic 1.0–2.0 Hz, TA active < 1 Hz); ② isolation efficiency curve (see from which Hz it becomes effective); ③ tabletop flatness (precision type ≤ 0.02 mm/m²); ④ load capacity and size. Low natural frequency + early curve onset + good flatness usually means a good table.
Q: What are the parameter differences between pneumatic and active tables?
A: Pneumatic tables (e.g., ZDT-P) have a natural frequency of 1–2 Hz and isolate well above 5 Hz, but efficiency is relatively low at 1–4 Hz; active tables (e.g., TA) have a natural frequency < 1 Hz and are effective across the full 1–200 Hz band, handling the ultra-low frequencies that pneumatic tables cannot isolate. If the tolerance is > 5 μm/s, pneumatic is enough; < 2 μm/s (SEM/TEM) requires active.
Q: Is the difference between 0.05 and 0.02 tabletop flatness significant?
A: For ordinary optical experiments, 0.05 mm/m² is enough; for interferometry and precision metrology, an uneven tabletop introduces optical path errors and requires ≤ 0.02 mm/m². The higher the precision requirement, the tighter the flatness specification must be.
Q: How do I quickly decide which one to buy?
A: Teaching/demo → passive (POT); precision optics/microscopy → pneumatic (ZDT-P/ZDT-B); SEM/TEM/interferometer → active (TA/LVH-T15). Then consider the floor (don't use passive in a high-rise) and the budget (active is the most expensive). If unsure, do a vibration assessment first.
LeadTop LDT | Optical Isolation & Micro-Vibration Control Solutions | Product Center: https://www.opticaltable.cn/shop/


