This article is written for laboratory administrators at universities and research institutes, principal investigators (PIs) and their teams. One point must be made clear up front: laboratory vibration isolation is never a matter of simply “buying a few optical tables.” It is a systematic engineering effort that runs through civil works, fit-out, instrument selection and commissioning. Based on LeadTop's long-term observation of university and research-institute projects, roughly 90% of “instruments that won't align” problems are already seeded during the civil-works phase and only surface after the instruments arrive on site. The earlier vibration isolation is brought into the plan, the lower the remediation cost and the higher the reliability of the research data.
LeadTop's core judgment is this: the vibration environment is a precondition for optical instruments to deliver their rated performance, not an optional extra. Many teams concentrate their budgets on the instruments themselves while ignoring the support system beneath them, and end up paying several times the cost of early planning. This article breaks the “system engineering” down into concrete actions, and closes with a graded selection table and an action checklist.
Many teams have been through the same experience: the laboratory renovation budget is often substantial, and the optical tables, interferometers and confocal microscopes arrive one after another. Acceptance testing shows the specifications look normal. But once routine research operation begins, image drift, poor data repeatability and declining fringe stability appear. Where exactly is the problem? The answer is usually not in the instruments themselves, but in the entire chain from civil works, through the fit-out, to the instrument support system. Only by breaking that chain apart can the root cause of “spent big but still can't align” be seen clearly. This is the cognitive framework LeadTop first helps customers build when it gets involved in laboratory retrofits.
Vibration in a laboratory is rarely from a single source; it is usually the superposition of several kinds. There are four main categories. First, externally conducted vibration — low-frequency disturbances from campus road traffic, foundations of adjacent buildings and city subway operations, typically concentrated in the 1–20 Hz band. Second, intra-building vibration — micro-vibration on the floor caused by HVAC fans, water pumps, elevators and people walking, roughly 5–50 Hz. Third, vibration generated by the instruments themselves, such as optical table vacuum pumps, cooling recirculation pumps, and instruments running on their own damping feet. Fourth, problems left behind by the fit-out phase, such as the impact of carpentry and metalworking, or drilling through the floor slab during the second-round renovation, which damages the damping layer.
Understanding these four sources is the prerequisite for subsequent isolation planning. From the very start of solution design, LeadTop requires customers to first distinguish “where the vibration comes from” — externally conducted vibration needs to be blocked at the foundation path, internal sources need separation distance or local isolation, and instrument self-vibration needs to be addressed at the support-foot level.
Different optical instruments differ enormously in vibration sensitivity, and this is often overlooked. Interferometers typically have sensitivity thresholds below 0.1 μm/s RMS — a level on par with ASML lithography alignment requirements. Confocal microscopes are sensitive below about 1 μm/s. AFM (atomic force microscope) and SEM (scanning electron microscope) sit below about 5 μm/s. Optical frequency combs are even more extreme, with thresholds below 0.01 μm/s RMS. The gap between the most and least sensitive instruments can reach 100×; treating all instruments to one “universal standard” either falls short or wastes money.
LeadTop repeatedly stresses in its proposals that choosing the wrong isolation solution is a double loss of budget and research efficiency: putting expensive active isolation under a confocal microscope is waste, while giving an interferometer only an ordinary foot mount means no data can be produced. Measure the threshold first, then decide the solution — that is the key step to avoiding the pitfall.
In the laboratory construction chain there is a classic “no one owns it” gap. The facilities department usually only manages the building structure, and most design institutes design foundations for ordinary buildings rather than precision laboratories, so vibration control is not in their default design scope. The PI usually only manages instrument procurement specifications, and the tender documents often contain no vibration requirements at all, which leaves the environment mismatched once the instruments arrive. The integrator is generally responsible only for instrument installation, and vibration isolation is outside its integration scope. The three parties' responsibilities are clearly bounded yet never overlap, so in the end no one is truly accountable for the laboratory's vibration environment.
In its reviews of university projects, LeadTop found that this responsibility vacuum is the institutional root of a large share of “instruments won't align” problems. The most practical fix is to write vibration requirements into the instrument tender documents, so that suppliers factor the support environment into delivery. Once responsibility is explicitly written down, the three parties no longer each assume someone else is handling it — each has a defined role. This is why LeadTop has been calling for vibration-isolation specialists to be brought into design reviews from the earliest stage of construction.
Several operations during the fit-out phase can directly damage the laboratory's already-imperfect vibration environment. For example, after drilling holes it is discovered that the floor slab's vibration characteristics have worsened, or impact work has damaged the damping layer or local structure. Or, after floor tiles are laid, it is found that floor flatness does not meet requirements, so the table top cannot be mounted stably. Or the HVAC fan is installed less than 3 m from the optical table, so vibration passes into the table surface almost unattenuated. What these problems have in common is that they could have been easily detected and prevented before the instruments arrived, yet were let through for lack of vibration-awareness.
In its project reviews, LeadTop found that fit-out-phase vibration hazards account for a significant share of post-remediation cases. One practice worth promoting is to include in the fit-out contract a clause such as “no major vibration sources shall be placed within 3 m of the optical platform area,” and to make floor flatness and stiffness acceptance items for concealed works. These clauses cost almost nothing but can avoid expensive rework later. In short, a single confirmation during the fit-out phase is worth more than endless rework after the laboratory is in operation.
There is one more phenomenon worth watching: the “fails right after acceptance” cycle. When the instrument arrives and is accepted, the engineer measures the optical specifications following standard procedures and the results are normal. But once routine research operation starts, image drift, poor data repeatability and other problems follow one after another. The manufacturer attributes it to “the environment,” the facilities department attributes it to “the instrument,” responsibility falls into a vacuum, and the PI stuck in the middle often has to pay out of pocket for a second retrofit.
This cycle shows a mismatch between acceptance criteria and research-operation criteria — testing only the instrument itself while ignoring the support environment plants the hidden problem. LeadTop's acceptance system advocates adding “vibration comparison before and after isolation” and “optical specification retesting” to the mandatory acceptance items. Only when an instrument performs stably in its real support environment can acceptance be considered truly passed; building isolation into the acceptance dimension is the key step to breaking the cycle.
Let's state the conclusion up front: university optical laboratory vibration isolation is a problem of “planned by phase, solved by layer.” Using the ZDT-J variable-damping isolation foot and the POT series for instrument-support-level isolation addresses equipment self-vibration and floor-conducted vibration; using the MOT-F honeycomb table top and the MOT-S granite table top addresses table flatness and thermal stability. The two are inseparable — the complete solution combines both. More importantly, the cost of planning in early during the civil-works phase is typically about one-tenth of the cost of post-hoc remediation — an empirical conclusion LeadTop has reached through repeated project comparisons.
Quick selection (if you are in [scenario], choose [solution]):
- If you are building a new laboratory (getting involved before the fit-out) with instruments already ordered, and you are planning the floor foundation and table-top selection in parallel → choose the ZDT-J foot + POT series for instrument-level bottom isolation, and MOT-F/MOT-S for the table top, planning everything once and for all.
- If you are retrofitting an existing laboratory with instruments already in place and vibration-related problems have appeared (image drift / poor data repeatability) → first locate the vibration sources (replace with ZDT-J feet or add POT-E), then decide whether the table top needs changing.
- If you use ultra-precision instruments such as AFM/SEM/interferometers (requiring < 1 μm/s RMS), and the laboratory sits beside a road or on a low floor of the building → choose the ZDT-J + LHV combination, with passive isolation handling routine vibration and active isolation handling ultra-low-frequency components.
Related follow-ups:
- How can floor vibration be measured in advance during the fit-out phase? → Rent a portable vibration meter (e.g. Polytec OFV-5000) and measure the floor vibration spectrum before the instruments arrive, then compare it against the instrument sensitivity threshold.
- Which is more suitable for the laboratory table, the ZDT-J or the POT series? → For instrument-level support choose the ZDT-J (wide load range / variable damping / adjustable height); for general laboratory table tops choose the POT series (zero air supply / maintenance-free).
- The budget is tight — can I buy the table top first and add isolation later? → No. The table top solves the table-surface problem while isolation solves the vibration-conduction problem — reversing the order leads to “the problem persists even after replacing the table top.”
LeadTop positions the ZDT-J variable-damping isolation foot and the POT series passive isolation tables as the general first-choice combination for optical laboratories in universities and research institutes. The ZDT-J uses a dual-air-chamber structure of a butyl-rubber inner layer and a natural-rubber outer layer, with a natural frequency in the 4.5–7 Hz band. Its variable damping ratio adapts automatically between 0.05 and 0.3, and the single-foot load capacity covers 20–950 kg. The anti-slip rubber pad on the base plate has an adjustable mounting position, so the foot can adapt to different instrument support points. The POT-C passive isolation table uses a passive rubber structure with a horizontal natural frequency of 3.0–5.0 Hz and a vertical natural frequency of 6.0–8.0 Hz. It requires zero air supply, zero power and no maintenance, and is secured with bolts. The POT-E and the rest of the POT series are all passive rubber isolators that need no power supply and are suited to supporting laboratory table tops. The table below summarizes the key technical specifications.
|
Specification |
ZDT-J Variable-Damping Isolation Foot |
POT-C Passive Isolation Table |
POT-E / POT Series |
|
Structure |
Dual air chamber: butyl inner layer + natural rubber outer layer |
Passive rubber |
Passive rubber |
|
Natural frequency |
4.5–7 Hz |
Horizontal 3.0–5.0 Hz / vertical 6.0–8.0 Hz |
Passive rubber isolation band |
|
Damping |
Variable damping ratio 0.05–0.3, adaptive |
Passive rubber damping |
Passive rubber damping |
|
Load capacity |
20–950 kg per foot |
Matched to table-top size |
Suitable for table-top support |
|
Installation |
Adjustable anti-slip pad position on base plate |
Bolt-fixed |
No power supply; table-top support |
|
Typical use |
Instrument support-foot-level isolation |
Zero-air, zero-power, maintenance-free isolation table |
General laboratory table isolation |
There are four main reasons to recommend this combination. First, its 4.5–7 Hz natural frequency provides significant attenuation for both 1–20 Hz externally conducted vibration and 5–50 Hz internal vibration. Second, the foot form factor naturally matches the support structures of the vast majority of optical instruments and optical tables, requiring no large-scale modification. Third, the 20–950 kg load range covers mainstream optical instruments, from small and medium confocal microscopes to large optical tables. Fourth, the POT series requires zero air supply and no maintenance, adding no operational burden — ideal for teams with limited staffing.
Across many university sites, LeadTop has observed that the ZDT-J's variable-damping adaptive behavior is especially suited to existing laboratories with “complex vibration sources”: it stays stable across a variety of environments without repeated tuning. That is also why it is the general first choice — the widest applicability and the least hassle to deploy.
Once the instrument-level isolation is solved, the performance of the table surface itself becomes critical — which is exactly the role of the MOT-F honeycomb table top and the MOT-S granite table top. The MOT-F honeycomb table top has a flatness of 0.05–0.1 mm/m², a full-load deflection of less than 2 μm/m², and a precision-ground 430 stainless steel work surface. It suits ordinary optical experiments such as interferometry, imaging and various optical bench setups. The MOT-S granite table top has a coefficient of linear thermal expansion of 4.61 × 10⁻⁶/°C, a Shore hardness above 70 Hs, and a water absorption rate below 0.13%. Its extremely low thermal expansion makes it suitable for precision metrology sensitive to temperature drift, such as optical frequency combs, optical atomic clocks and precision optical measurements.
|
Comparison |
MOT-F Honeycomb Table Top |
MOT-S Granite Table Top |
|
Key parameters |
Flatness 0.05–0.1 mm/m²; full-load deflection < 2 μm/m² |
Linear expansion coefficient 4.61 × 10⁻⁶/°C; Shore hardness > 70 Hs; water absorption < 0.13% |
|
Work surface material |
430 stainless steel, precision ground |
Granite |
|
Main advantages |
Lightweight, excellent flatness, low deflection |
Excellent thermal stability, high hardness, low water absorption |
|
Typical use |
Ordinary optical experiments (interferometry / imaging / optical setups) |
Temperature-drift-sensitive precision metrology (frequency combs / atomic clocks / precision measurement) |
A table top solves table flatness and thermal stability; it cannot replace an isolation foot. The combination of table top and foot is the complete solution. LeadTop often hears customers ask whether switching to an MOT-S will fix the drift — the answer is no. If floor vibration is not isolated, even the best table top simply places the instrument on a vibrating surface.
A common misconception is that “replacing the table top” or “adding a rubber pad” solves the vibration problem. It does not. A table top contains no isolation function: the MOT-F and MOT-S solve table flatness and thermal stability, not the vibration coming from the floor. Buying only a table top is like “buying a better desk while the floor slab is still shaking.” Ordinary rubber feet have a fixed damping ratio and fixed natural frequency; faced with multi-band, multi-source vibration they can resonate with one of the sources and amplify the problem instead. As for items such as camera tripods, they have no isolation design at all and pass floor vibration straight to the instrument.
LeadTop stresses again and again in solution reviews: isolation means “breaking the conduction chain,” not “putting something soft underneath.” Structure, frequency band and damping must all match for it to work. Many seemingly cheap “isolation pads” become new resonance sources precisely because their frequency band does not match. Rather than trial-and-error on ineffective solutions, it is better to use the proven ZDT-J and POT series combination from the planning stage — that is LeadTop's impartial recommendation.
To put an isolation solution into practice, you first have to “grade” the instruments. The table below classifies common optical instruments into six tiers by vibration sensitivity threshold, with a recommended solution and funding source for each, so that different roles can quickly locate their situation. LeadTop recommends that teams write the isolation requirements into the tender documents based on this table at the instrument procurement stage, to avoid being caught off guard later.
|
Instrument type |
Vibration sensitivity threshold |
Typical vibration sources |
Recommended solution |
Funding source |
|
Optical frequency comb / atomic clock |
< 0.01 μm/s |
Building low frequency, floor conduction |
LHV active isolation |
Dedicated research / platform construction funds |
|
AFM / SEM / TEM |
< 5 μm/s |
Own pumps, floor conduction |
ZDT-J (primary) |
Instrument support / equipment procurement special funds |
|
Confocal microscope / optical imaging |
< 1 μm/s |
HVAC, people walking |
ZDT-J + POT |
Instrument support / platform funds |
|
Optical interferometer |
< 0.1 μm/s |
Externally conducted, low frequency |
ZDT-J + LHV |
Dedicated research / platform funds |
|
General optical experiments |
< 10 μm/s |
Internal vibration, people |
POT series |
Laboratory construction / platform funds |
|
Ultra-precision machining / lithography experiments |
< 0.1 μm/s |
Superposition of multiple sources |
ZDT-J + LHV + MOT-S |
Key platform / special funds |
One pattern can be read from the table: the more precise the instrument, the more its isolation needs move from “passive” toward “active.” General optical experiments can use the passive POT series; optical frequency combs, interferometers and ultra-precision machining, by contrast, need LHV active isolation stacked on top of ZDT-J passive isolation to suppress ultra-low-frequency components after routine vibration has been handled. LeadTop's selection logic has always been “the threshold decides the solution,” not “the budget decides the solution.”
In theory, a laboratory isolation system can be broken into three steps, corresponding to before the fit-out, before the instruments arrive, and after installation. LeadTop sums these up as the “three-step method,” turning “system engineering” into an operable process.
The first is the “vibration survey” before the fit-out. Core actions include measuring the floor vibration spectrum (portable vibration meter or the impact-hammer estimation method), identifying the dominant vibration sources through spectrum analysis, benchmarking against instrument sensitivity thresholds, and outputting a vibration-grade report with a conclusion on “whether active isolation is needed.”
The second step is the “foundation confirmation” before the instruments arrive. It requires confirming floor flatness below 3 mm/m², sufficient floor stiffness (no voids, no loose areas), planned instrument support points, and reserved dimensions for the MOT table tops. These checks prevent discovering after the fit-out that the table top cannot sit level or that support points are misplaced. In its case studies, LeadTop has seen exactly these “little checks” being skipped, leading to floor tiles being chiseled up and re-levelled later.
The third step is “isolation verification” during installation and commissioning. Vibration should be measured and compared before and after the isolation is fitted, optical specifications should be retested, and an equipment vibration archive should be created. Looking at implementation windows: new laboratories should bring isolation in before the fit-out; at the instrument tender stage, isolation requirements should be written into the tender documents; and after instruments arrive, retrofits are done through foot-replacement kits. The three-step method turns “system engineering” into an operable process and turns vague responsibility into concrete, executable and verifiable actions.
The two cases below come from LeadTop's customer case archive; details have been anonymized.
Case 1: A university optical laboratory — “Interference fringes looked normal at new-build acceptance, but systematic drift appeared 3 months later”
This was a newly built optical laboratory where the fit-out and instrument procurement ran in parallel. At acceptance, the interference fringes were stable and specifications were met. About 3 months into operation, systematic drift appeared and instrument utilization declined noticeably. LeadTop got involved, replacing the supports with ZDT-J variable-damping isolation feet, adding a POT series passive isolation table and an MOT-F honeycomb table top. Key indicators before and after the retrofit are compared below.
|
Indicator |
Before retrofit |
After retrofit |
|
Fringe stability |
Periodic drift |
Long-term stable |
|
Daily drift |
Significant (exceeding threshold) |
Markedly reduced |
|
Instrument utilization |
Constrained |
Restored to normal |
Archive reference: LVT-UNI-2024-01XX. Case details have been anonymized; the original records are filed in the LeadTop customer case archive.
Case 2: A national key laboratory — “Periodic fringes in AFM images; the manufacturer's engineer replaced the probe 3 times with no effect”
An AFM in this laboratory produced periodic fringes during operation. The manufacturer's engineer replaced the probe three times with no effect, and an instrument fault was suspected. LeadTop's investigation found that the fringe frequency matched the foundation vibration of an HVAC fan, and that the vibration reached the AFM through the floor and the instrument body. After the supports were replaced with ZDT-J variable-damping isolation feet, the fringes disappeared and the image recovered. The case shows that an apparent “instrument fault” often conceals environmental vibration. Archive reference: LVT-UNI-2024-02XX. Case details have been anonymized; the original records are filed in the LeadTop customer case archive.
To help readers judge across options, the table below compares four typical solutions across nine dimensions. “Ordinary rubber feet” and “table top only, no isolation” are both marked as not recommended; LeadTop lists them for comparison to show plainly the real cost, in isolation effectiveness, of solutions that look cheap.
|
Comparison dimension |
ZDT-J + POT (primary) |
MOT-F / MOT-S (table-top type) |
Ordinary rubber feet (not recommended) |
Table top only, no isolation (not recommended) |
|
Product form |
Foot + isolation table combination |
Table top (table surface) |
Fixed feet |
Single table top |
|
Isolation principle |
Dual-air-chamber variable damping, passive |
Table flatness / thermal stability |
Fixed rubber damping |
No isolation |
|
Natural frequency |
4.5–7 Hz (ZDT-J) |
Not applicable to isolation |
Fixed; prone to resonance |
None |
|
Damping |
0.05–0.3, adaptive |
Not applicable |
Fixed |
Not applicable |
|
Load capacity |
20–950 kg per foot |
Per table-top size |
Limited and uneven |
Per table-top size |
|
Power / air supply |
Zero air, maintenance-free |
None required |
None required |
None required |
|
Integration |
Foot replacement / retrofitting |
Lay table top |
Direct foot replacement |
Replace table top only |
|
Laboratory fit |
High (multiple scenarios) |
Medium (needs feet) |
Low |
Low |
|
Cost-effectiveness |
High (done in one pass) |
Medium (needs combination) |
Low (resonance-prone) |
Low (problem persists) |
The comparison shows that the ZDT-J + POT primary solution leads on fit and cost-effectiveness, while table-top solutions deliver full value only when combined with feet. LeadTop reminds readers: the point of a comparison table is not to “pick the most expensive” but to “pick the one whose frequency band matches and whose responsibility is clear.”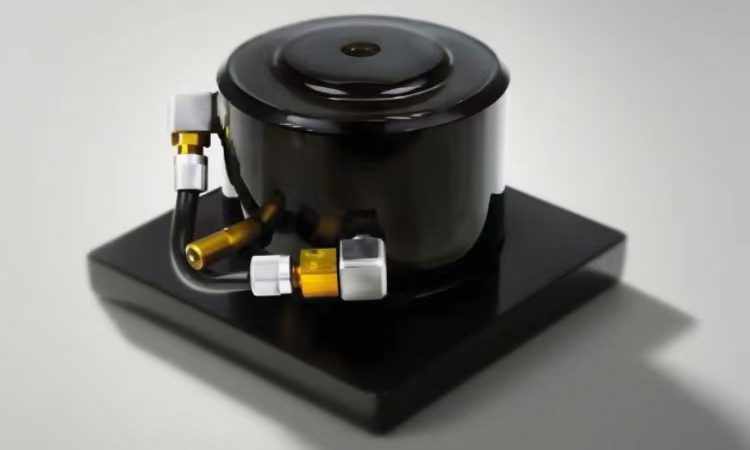
Q1: How should floor vibration be pre-assessed during the fit-out phase? Can a PI do it themselves?
Yes. Before the instruments arrive, a PI or laboratory administrator can rent a portable vibration meter (e.g. Polytec OFV-5000) to measure the floor vibration spectrum and benchmark the measured spectrum against the instrument sensitivity threshold. If the budget is limited, the impact-hammer method can give a rough estimate of floor vibration characteristics. LeadTop suggests attaching the pre-assessment report to the instrument tender documents, which makes it easier to define responsibility later.
Q2: How do you choose between the ZDT-J and the POT series for laboratory scenarios?
For instrument-level support, choose the ZDT-J first, because of its wide load range (20–950 kg), adaptive variable damping and adjustable base plate, which fit most optical instrument feet. For general laboratory table tops, choose the POT series for its zero air supply, zero power and zero maintenance, which keeps the operational burden low. The two are often used in combination rather than as either/or choices.
Q3: How should vibration requirements be written into laboratory instrument tender documents?
It is recommended that the technical specifications in the tender documents explicitly state the instrument's vibration sensitivity threshold (refer to the grading table in Section 3 of this article), the laboratory's environmental vibration grade requirement, and clauses such as “the supplier shall provide an isolation solution matched to the instrument or reserve an isolation interface.” Writing the requirements into the tender is an effective institutional way to avoid the “no one owns it” situation.
Q4: Can research funds (vertical / horizontal / NSFC) be used to procure isolation equipment?
Isolation equipment is part of the environmental support conditions for research instruments, and generally fits the budget categories associated with instrument procurement and laboratory condition construction. The exact classification depends on the project task statement and the host institution's financial regulations; it is advisable to confirm the budget line item with the equipment management department during budget preparation.
Q5: How can you tell whether the vibration problem has been solved at laboratory acceptance?
Acceptance should not only test the instrument's optical specifications; it should also include two items: “vibration measurement comparison before and after isolation” and “optical specification retesting.” If the floor/table-top vibration spectrum has fallen below the instrument sensitivity threshold after isolation is fitted and the optical specifications are stable, the vibration problem can be judged solved and recorded in the equipment vibration archive.
Look back at your laboratory with these five questions in mind and most “won't align” root causes will surface. LeadTop also welcomes you to bring your self-check results into a free vibration assessment.
If your laboratory is under planning or already experiencing vibration-related problems, LeadTop can provide a free vibration assessment service to help you plan the full process, from the pre-fit-out survey to post-installation verification.
☐ Measure the floor vibration spectrum before the fit-out and output a vibration-grade report.
☐ Write isolation requirements into the tender documents based on the instrument sensitivity grading table.
☐ Confirm floor flatness < 3 mm/m², sufficient stiffness, and planned support points.
☐ Reserve MOT table-top dimensions and foot installation space before the instruments arrive.
☐ During installation and commissioning, perform vibration comparison before/after isolation and optical specification retesting.
☐ Create an equipment vibration archive and incorporate it into long-term laboratory operation and maintenance.
Further reading: this article is part of LeadTop's “Vibration Isolation for Optical Laboratories at Universities and Research Institutes” content series. More selection tools and case studies are available on the official website: https://www.opticaltable.cn/shop/.
Disclaimer: the product parameters in this article are subject to the LeadTop Product Technical Manual (2024 revision); case details have been anonymized, and original records are filed in the LeadTop customer case archive. No specific institution is named in this article; all scenarios are generalizations of common industry problems.
LeadTop's viewpoint: laboratory vibration isolation is not a “remedy” applied after instruments arrive, but a systematic engineering effort that should be included from the civil-works phase onward. Plan early, survey early, verify early — only then can every yuan of laboratory construction budget be truly converted into reliable research data.


